


Gantt Chart Guide
The Gantt Chart provides a detailed timeline view of tasks within a project, showcasing their start dates, durations, and progress. It is a valuable tool for project planning and management.
1. Overview of the Gantt Chart
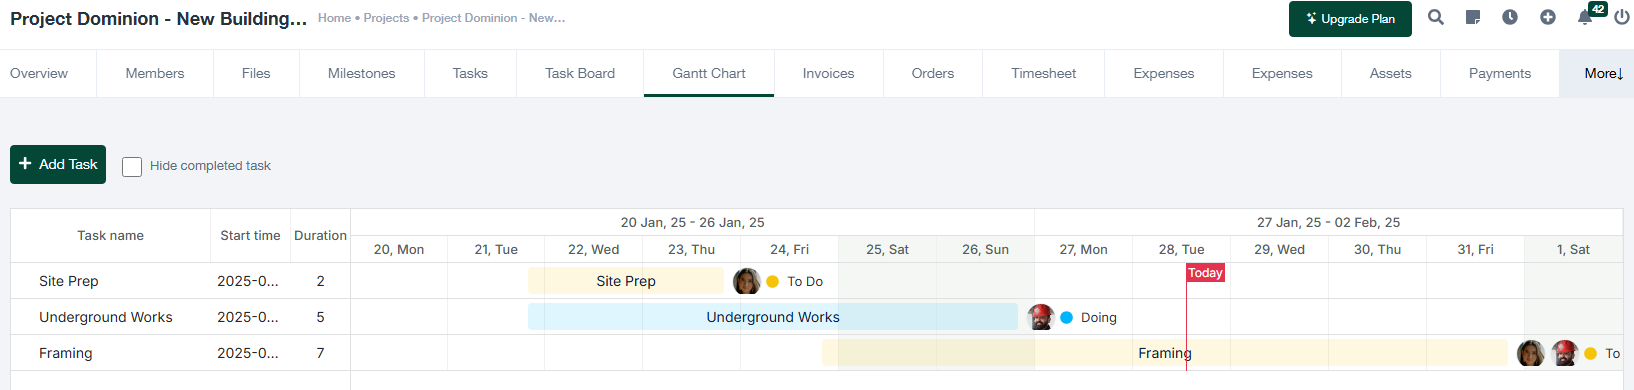
The Gantt Chart visually represents tasks as horizontal bars along a timeline. Each bar reflects the task’s duration and current status.
- Task Name: The title of the task being tracked.
- Start Time: The starting date of the task.
- Duration: Number of days the task is expected to take.
- Timeline: Weekly or daily breakdown of the project timeline.
- Status Indicators: Task statuses such as “To Do,” “Doing,” or “Completed” are displayed on the timeline.
2. Adding a Task
To add a task directly to the Gantt Chart:
- Click on the + Add Task button located above the chart.
- Fill in the task details, including:
- Task name
- Start date
- Duration
- Assigned team members
- Status
- Click Save to add the task to the Gantt Chart.
3. Navigating the Gantt Chart
Use the following features to navigate and manage the chart:
- Scroll: Move horizontally to view different time periods.
- Timeline Labels: The top row displays dates and weeks for easy reference.
- Highlighting Today: A red line indicates the current day for reference.
- Task Bars: Click on any task bar to view or edit task details.
4. Key Features
- Color Coding: Tasks are color-coded based on their current status.
- Assigned Team Members: Icons display team members responsible for the task, shown on the task bar.
- Hide Completed Tasks: Check the Hide completed tasks box to declutter the chart and focus on pending tasks.
- Adjustments: Update task details directly in the task list or by editing the task in the Gantt Chart view.
5. Best Practices for Using the Gantt Chart
- Ensure task start dates and durations are accurately entered for effective planning.
- Regularly update task progress to keep the chart current.
- Review the timeline weekly to identify delays or overlaps in tasks.
- Communicate with team members assigned to tasks to confirm schedules and status.
The Gantt Chart is an indispensable tool for project managers, providing a clear overview of the project’s timeline and progress. For further assistance, refer to the system documentation or contact the project administrator.